The inequalities between those at the base of the economic pyramid and those at the tip can be traced through nested layers of inequality: between capital and labour, between formal and informal workers, between different groups of informal workers — and between women and men at each level.
In today’s globalized economy, income and wealth are concentrated at the tip of the economic pyramid and the formal workforce is trying to hold onto the gains it has made over the years. At the same time, previously formal work is being informalized, new forms of informal work are being created, and informal workers are facing new challenges.
Inequality between Capital and Labour
According to French economist Thomas Piketty (among others), economic growth, which results from productivity gains and is accompanied by population growth, tends to lead to economic convergence as prior wealth has relatively less impact under such circumstances. But today, Piketty argues, declining rates of population growth is one factor that is pushing concentrations of wealth — and returns to capital — to unprecedented levels (Piketty 2013/2014).
Further, while technological progress can raise labour productivity and boost wages, it can also make it easier for owners of capital to substitute capital for labour and to contract labour without contributing to worker benefits and protections (think Uber drivers). Whether or not one subscribes to all of Piketty’s arguments, there is little doubt that today, economic growth has enhanced returns to capital and concentrated income and wealth at the tip of the economic pyramid — undermining labour’s share of income and wealth, especially among informal workers at the base of the economic pyramid.
Inequality between Formal and Informal Workers
In June 2002, in its conclusions to a tripartite discussion on Decent Work and Informal Employment, the International Labour Conference (ILC) recognized that informal workers face greater deficits than formal workers in regard to the four pillars of decent work:
- economic opportunities
- rights
- social protection
- voice.
In addition to greater deficits in decent work, the working poor in the informal economy face greater deficits in decent living — they have less access to adequate and affordable health, education, housing and basic infrastructure services. Most live, and some work, in informal underserved settlements. There is an inverse correlation between levels of education and informal employment: 90 per cent of those with no education and 85 per cent of those with only primary education are informally employed, while roughly half of those with secondary education and a quarter of those with tertiary education are informally employed (ILO 2018; Bonnet et al 2019).
Making matters worse, the working poor in the informal economy — especially the self-employed — face greater exposure to risks and shocks than formal workers, including high exposure to:
- policy uncertainty and policy hostility (as existing policies and laws tend to be biased against them)
- economic shocks and risks (shifts in demand, prices and competition)
- occupational health and safety risks (associated with both their work and their workplaces).
Despite high exposure to risks and shocks, the working poor in the informal economy have limited (if any) access to legal and social protections.
Inequality within the Informal Economy
The WIEGO Network commissioned reviews of the links between informality, poverty, and gender in the late 1990s: one of available literature (Sethuraman 1998), the other of available statistics (Charmes 1998). Both found a similar hierarchy of earnings and segmentation by employment status and sex.
In 2004, WIEGO commissioned data analysts to test this model in Costa Rica, Egypt, El Salvador, Ghana, and South Africa by analyzing national data in those countries (Chen et al. 2005). (For more on these studies, see Links with Poverty.) In all countries, average earnings went down and the risk of being from a poor household went up as workers moved down the employment statuses in WIEGO’s Multi-Segmented Model of Informal Employment, shown below.
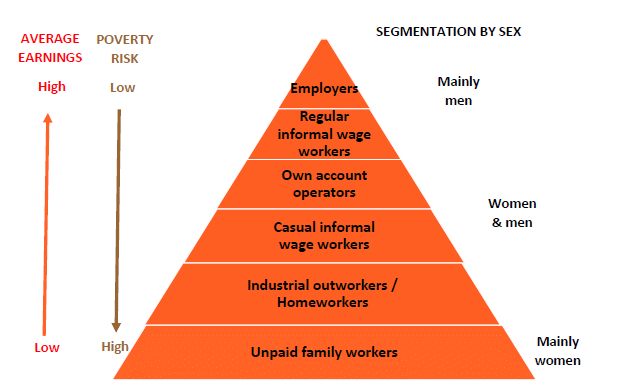
Testing the Model
This model was tested most recently in South Africa by Mike Rogan, a research associate with the WIEGO Urban Policies Programme and at Rhodes University, who analyzed the 2015 South African Quarterly Labour Force Surveys (Rogan and Alfers 2019).
Figure 2 depicts the hierarchy of average earnings and poverty risk within the informal economy by status in employment and sex. It shows that men are more likely than women to be employers, own account workers, employees inside and outside informal enterprises while women are more likely than men to be contributing family workers and domestic workers.
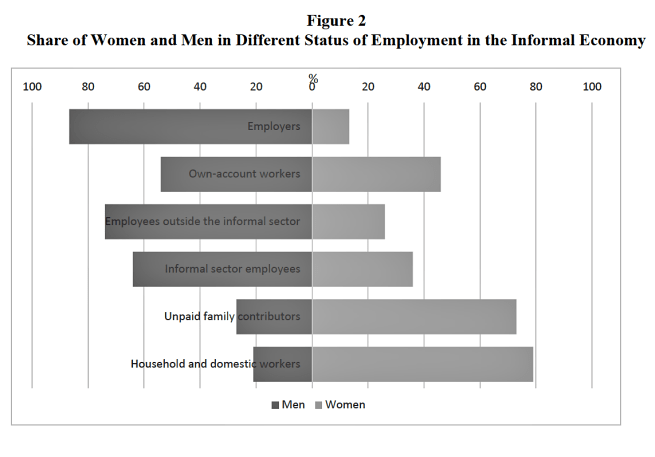
Source: Calculations by Mike Rogan from the 2015 South African Quarterly Labour Force Surveys (Rogan and Alfers 2019).
Figures 3 and 4 depict that among employers, employees in informal enterprises and domestic workers, women and men earn roughly the same and have roughly the same poverty risk; while men earn more and have a lower poverty risk than women among own-account workers and employees outside informal enterprises. It is important to note that, on average, all own account workers earn more, on average, than all informal employees, including those in both formal and informal enterprises: reflecting the very low wages for South African employees. It should be noted that women own account workers earn just over half what men own account workers earn; and that women own account workers earn less than both types of men employees (in both formal and informal enterprises).
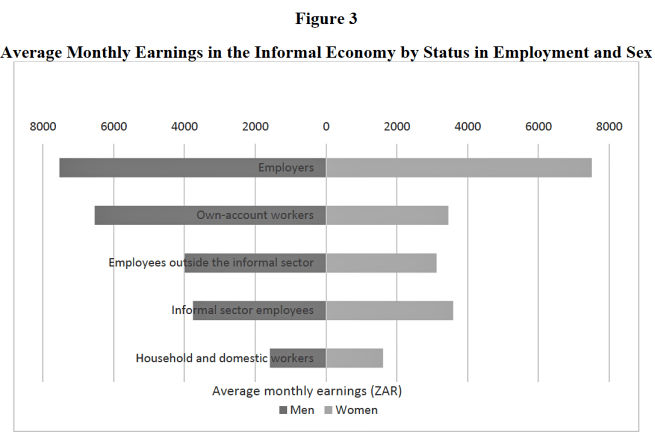
Source: Calculations by Mike Rogan from the 2015 South African Quarterly Labour Force Surveys (Rogan and Alfers 2019).
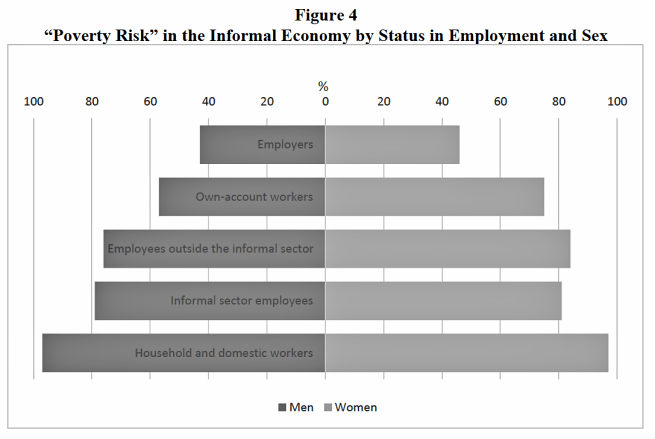
Source: Calculations by Mike Rogan from the 2015 South African Quarterly Labour Force Surveys (Rogan and Alfers 2019).
Notes on these figures:
1. The different segments of informal employment in South Africa depicted in in Figures 2, 3 and 4 correspond somewhat, but not completely, with the segments in the WIEGO model. The two main differences are that, in the South African pyramids, a) informal employees inside and outside the informal sector include both the “regular” and “casual” informal wage worker categories of the WIEGO model and b) household/domestic workers are disaggregated from the “regular” wage worker category in the WIEGO model.
2. Earlier data for South Africa, analyzed for Figure 1, distinguished between informal employees (who have a known employer) and casual wage workers (who do not have a regular employer).
Recent Data on Informality and Inequality
To understand income inequality across the workforce or population, data on the earnings of the rich or non-poor as well as the poor are needed. For WIEGO, G. Raveendran, former Additional Director General of the Central Statistical Organization of India, used recent national consumption survey data to analyze the intersection of main source of household income (by status in employment), social groups (by caste and religion), and location (by urban and rural) in determining poverty outcomes at the household level.1
This intersectional analysis, summarized below in the tables, provides a picture of both absolute and relative poverty/inequality across all households of India disaggregated by main source of household income, caste-religious groups and location.
Income poverty is usually measured in absolute terms as the proportion of the population below a particular poverty line. Income inequality refers to the disparities in relative income across the whole population: especially between the rich and the poor. By cross-tabulating households by main source of income and social group with the corresponding poverty head-count ratios, this analysis of Indian data reveals significant income inequality.
To interpret this analysis, it is important to understand the hierarchy of caste groupings in India. Scheduled Castes (SCs) and Scheduled Tribes (STs) are officially designated groups of historically disadvantaged people in the country who are listed in separate schedules of the constitution. The Scheduled Castes form part of the lower strata of Hindu community while the Scheduled Tribes are settlers in remote and inaccessible areas and belong to different religious groups. Other Backward Classes (OBCs) is the collective term of castes recognized by the Government as educationally or socially disadvantaged but not notified as SC or ST. All those not included in SC, ST or OBC lists are Upper Caste Hindus or the upper echelons of other religious groups. In India today, 29 per cent of the population belongs to Hindu Upper Castes or upper echelons of other religious groups, 43 per cent to the Other Backward Castes, 19 per cent to the Scheduled Castes, 9 per cent to the Scheduled Tribes.
Table 1 presents the percentage distribution of households of different caste-religious groups across the main sources of household income with the corresponding poverty head-count ratios. Self-employment is the most important source of household income overall (50%) and for Scheduled Tribe households (50%). Casual work is the second most important source of household income overall (27%) but the most important source for Scheduled Caste households (46%). Regular wage work is the third most important source of household income overall (18%) and especially for Christian households (36%) followed by Upper Caste Hindu households (28%). The highest poverty head-count ratio is for Scheduled Caste households who depend on casual work; the lowest poverty head-count ratios, excluding “other” households, is for Christian households which depend on self-employment (3%) and regular wage work (4%) followed by Upper Caste households which depend on regular wage work (8%).
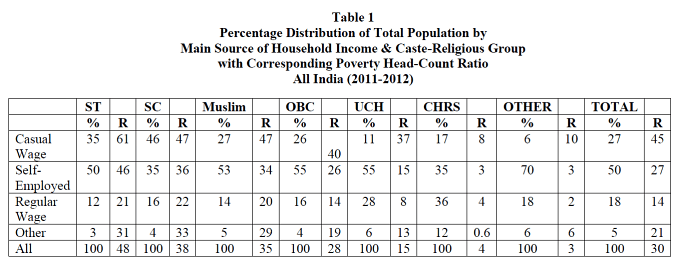
Notes:
1. The total population of India is estimated by using both design multipliers and population adjustment multipliers.
2. ST = Scheduled Tribe, SC = Scheduled Caste; OBC = Other Backward Castes: UCH = Upper Caste Hindu; Christian and Other do not include ST, SC or OBC.
3. % = percentage distribution; R = head count ratio
Source: Estimated by G. Raveendran using unit level data sets of Consumer Expenditure Survey, 2011-12.
Table 2 presents the head-count ratios for households above twice the poverty line by main source of household income and socio-religious groups. Scheduled Tribe households whose main source of work is casual wage work are the least likely to have incomes that are twice the poverty line. Excluding “other” sources of income, upper echelon Christian households which depend on regular wage work have the greatest likelihood (66%) of having incomes that are above twice the poverty line followed by Upper Caste Hindu households (48%). Among all households, those that depend on regular wage work are 6 times more likely that those that depend on casual wage work to have incomes that are above twice the poverty line.
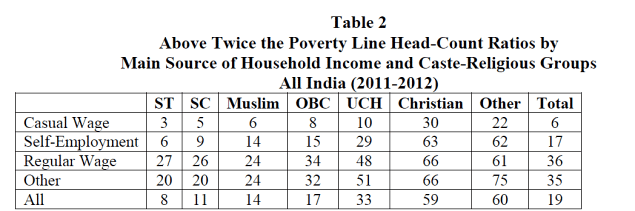
Note: ST = Scheduled Tribe, SC = Scheduled Caste; OBC = Other Backward Castes: UCH = Upper Caste Hindu; Christian and Other do not include ST, SC or OBC.
Source: Estimated by G. Raveendran, using unit level data sets of Consumer Expenditure Survey, 2011-12.
In sum, households that depend on causal work and self-employment as their main source of income are 3.2 and 2 times, respectively, more likely to be poor than households which depend on regular wage work. The households with the highest poverty head-count ratios are those which depend on casual work as the main source of income. In India, Scheduled Tribe and Caste households are 3-4 times as likely as Upper Caste households to depend on causal work, while Other Backward Caste and the Muslim households are more than twice as likely.
1 In his analysis of poverty estimates of households classified by main source of income and by social groups, G. Raveendran used the same estimation method, data set and poverty lines of the Expert Group (2012-14) on measurement of poverty headed by C. Rangarajan. The results of the latest Consumer Expenditure Survey have still not been released. The average monthly per-capita consumption expenditures on food items required to meet the specified normative nutritional requirements of calorie, protein and fat as computed from the Consumer Expenditure Survey, 2011-12 for rural and urban areas were taken as the food components of all-India poverty lines. The average monthly per-capita expenditures on groups of non-food items either of the median basket or food poverty line basket were then added to get the overall poverty lines. The all-India poverty lines for rural and urban areas were then split into state-specific poverty lines based on state-wise price differentials.